Debugging PMDO: Difference between revisions
From PMDOWiki
m Mac setup update |
mNo edit summary |
||
| (3 intermediate revisions by the same user not shown) | |||
| Line 1: | Line 1: | ||
See also: [[Contributing Code]] | |||
= PMDO Windows Debug Setup = | |||
# Download [https://dotnet.microsoft.com/en-us/download/dotnet/8.0 .NET 8.0]. You want to download the x64 version Confirm that it is installed using the command <code>dotnet --list-runtimes</code>. | |||
# Recursively clone the PMDO repository using <code>git clone --recurse-submodules -j8 https://github.com/audinowho/PMDODump.git</code>. | |||
# Open PMDOData.sln using [https://visualstudio.microsoft.com/thank-you-downloading-visual-studio/?sku=Community&channel=Release&version=VS2022&source=VSLandingPage&cid=2030&passive=false Visual Studio 2022] or later. | |||
# Set your configuration to Debug, x64. Build the entire solution | |||
# Set PMDC as the startup project and hit Debug. | |||
= PMDO Mac Debug Setup = | = PMDO Mac Debug Setup = | ||
| Line 5: | Line 14: | ||
Made by: Trio-#4442 | Made by: Trio-#4442 | ||
# Download [https://dotnet.microsoft.com/en-us/download/dotnet/ | # Download [https://dotnet.microsoft.com/en-us/download/dotnet/8.0 .NET 8.0]. You want to download the x64 version Confirm that it is installed using the command <code>dotnet --list-runtimes</code>. | ||
# Recursively clone the PMDO repository using <code>git clone --recurse-submodules -j8 https://github.com/audinowho/PMDODump.git</code>. | # Recursively clone the PMDO repository using <code>git clone --recurse-submodules -j8 https://github.com/audinowho/PMDODump.git</code>. | ||
# Copy all of the <code>.dylib</code> files in <code>PMDC/PMDC/runtimes</code> folders to <code>PMDC/PMDC</code>. Here’s what your file structure should look like: [[File:Debug_Mac_FolderStructure.png|frameless]] | # Copy all of the <code>.dylib</code> files in <code>PMDC/PMDC/runtimes</code> folders to <code>PMDC/PMDC</code>. Here’s what your file structure should look like: [[File:Debug_Mac_FolderStructure.png|frameless]] | ||
Latest revision as of 21:18, 2 October 2024
See also: Contributing Code
PMDO Windows Debug Setup
- Download .NET 8.0. You want to download the x64 version Confirm that it is installed using the command
dotnet --list-runtimes. - Recursively clone the PMDO repository using
git clone --recurse-submodules -j8 https://github.com/audinowho/PMDODump.git. - Open PMDOData.sln using Visual Studio 2022 or later.
- Set your configuration to Debug, x64. Build the entire solution
- Set PMDC as the startup project and hit Debug.
PMDO Mac Debug Setup
Note: This has only been tested with Jetbrains Rider and Visual Studio Code
Made by: Trio-#4442
- Download .NET 8.0. You want to download the x64 version Confirm that it is installed using the command
dotnet --list-runtimes. - Recursively clone the PMDO repository using
git clone --recurse-submodules -j8 https://github.com/audinowho/PMDODump.git. - Copy all of the
.dylibfiles inPMDC/PMDC/runtimesfolders toPMDC/PMDC. Here’s what your file structure should look like: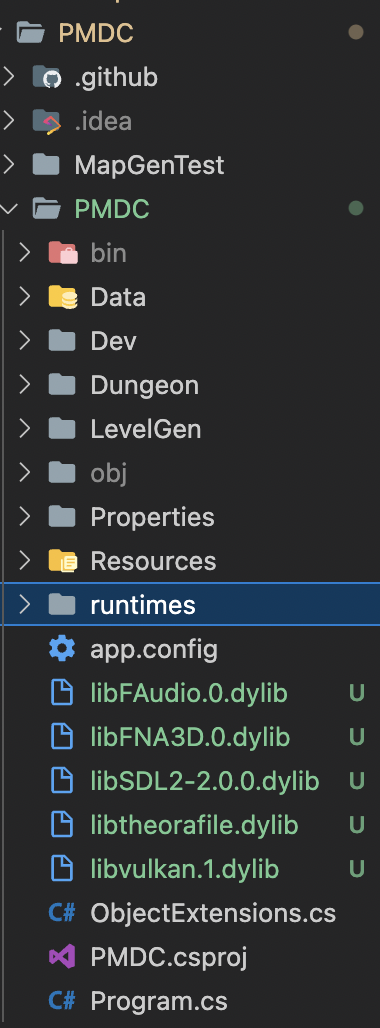
- In your
~/.gitignore_globalfile, add the following files for git to ignore:

# Debug logs (npm, yarn)
*.log

# Editor artifacts
.*.sw[a-z]
*~
.#*
.vscode
.idea

# OS files
Thumbs.db
.DS_Store
You may want to include more. Modified from here.
The following steps below depend on your IDE of choice. See each section below.
Jetbrains Rider
Jetbrains Rider requires a paid subscription.
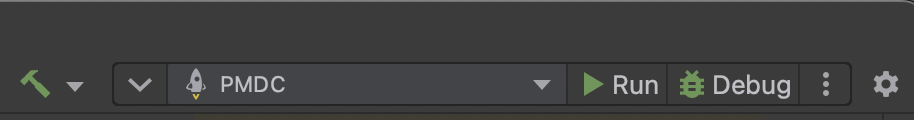
- Debug should run out of the box. Set the configuration to PMDC and click "Debug", and you should be all ready to go!
Visual Studio Code
- Install the C# extension. There is a possibility that you have to downgrade to an older version like
v1.24.4or modify the settings in Omnisharp settings discussed here? But I personally wasn’t able to figure out how to make it work. - Create
.vscode/launch.jsonin the root folder ofPMDODumpIn launch.json, copy everything from here to the file.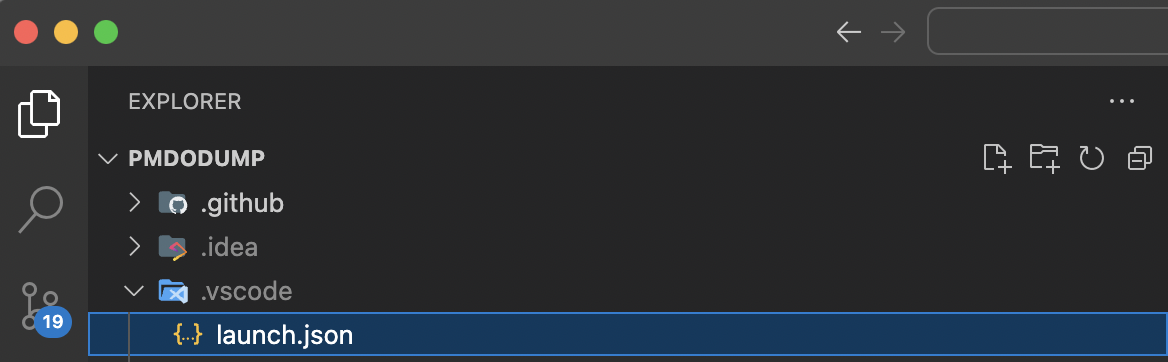
- In the
Run and Debugtab in VSCode, you can click on the green arrow to begin debugging.

